이 글은 https://opencv-python-tutroals.readthedocs.io/en/latest/py_tutorials/py_imgproc/py_contours/py_contours_hierarchy/py_contours_hierarchy.html#contours-hierarchy 를 참조로 하였습니다.
먼저 다음과 같은 코드가 있습니다.
import numpy as np
import cv2

img = cv2.imread('./data/opencv_contour_h.png')
imgray = cv2.cvtColor(img, cv2.COLOR_BGR2GRAY)
ret, thresh = cv2.threshold(imgray, 127, 255,0)

_, contours,hierarchy = cv2.findContours(thresh, cv2.RETR_LIST, cv2.CHAIN_APPROX_SIMPLE)

print(hierarchy)
cv2.imshow('img', img)

for i in range(len(contours)):
    cv2.waitKey()
    img = cv2.drawContours(img, contours, i, (0,0,255), 2)
    cv2.imshow('img', img)

print('END')
cv2.waitKey()
cv2.destroyAllWindows()
8번 코드의 cv2.findContours 함수의 2번째 인자에 따라 그 결과가 달라지는데, 특히 반환값 중 3번째인 hierarchy 값이 크게 달라집니다. hierarchy 값은 추출된 등치선 간의 계층 정보를 나타냅니다. cv2.findContours 함수의 2번째 인자에 따라 어떻게 변경되는지 요약 그림을 언급하는 선에서 정리합니다.
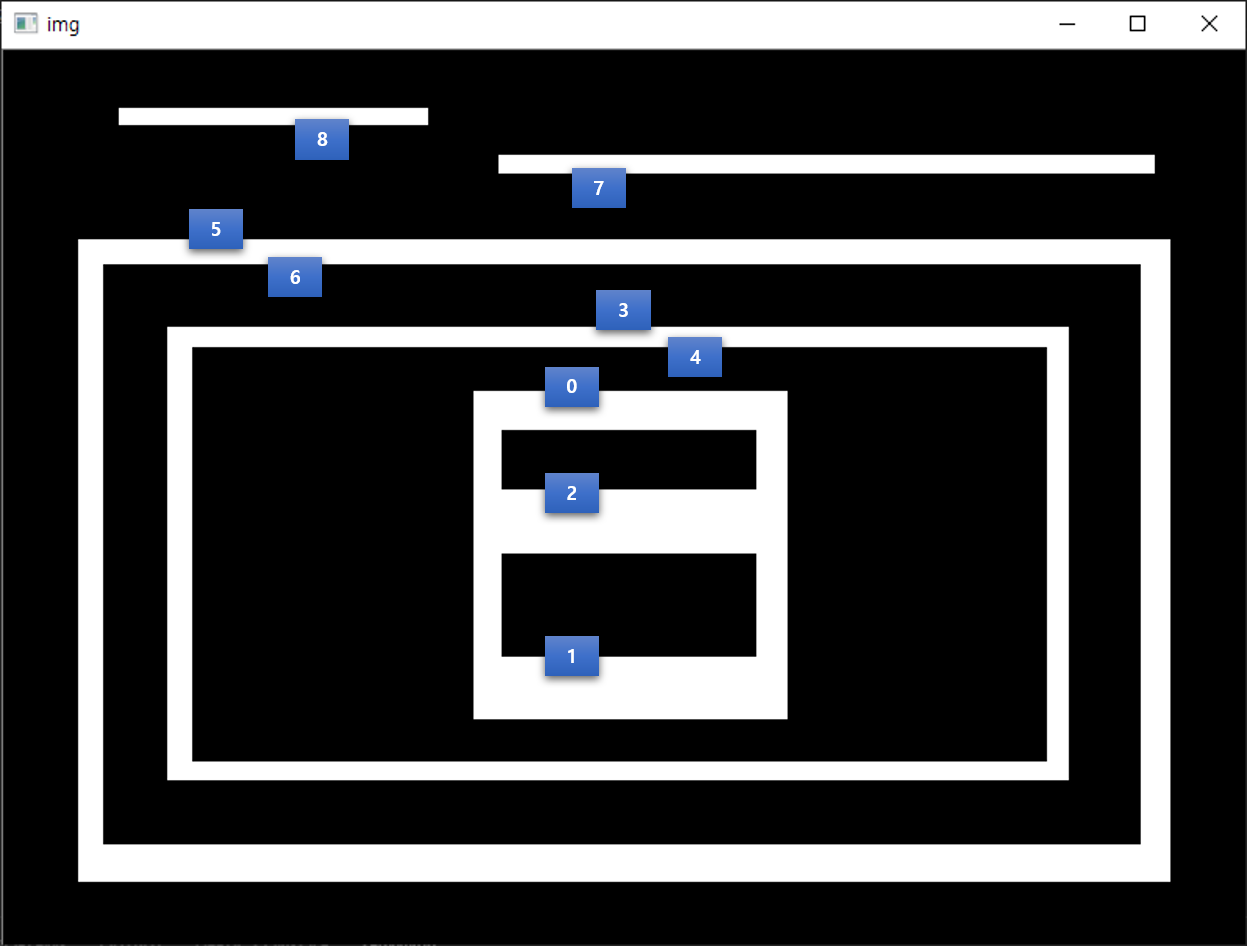
먼저 cv2.RETR_LIST 일 경우, 추출된 등치선의 인덱스 번호에 대한 그림입니다.
그리고 반환된 계층 정보는 다음과 같습니다.
[[[ 1 -1 -1 -1]
  [ 2  0 -1 -1]
  [ 3  1 -1 -1]
  [ 4  2 -1 -1]
  [ 5  3 -1 -1]
  [ 6  4 -1 -1]
  [ 7  5 -1 -1]
  [ 8  6 -1 -1]
  [-1  7 -1 -1]]]
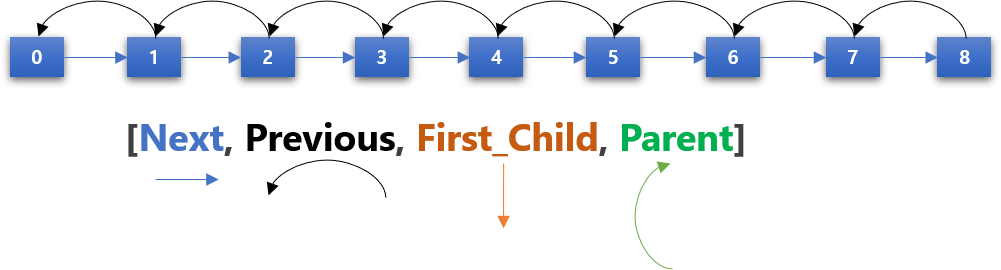
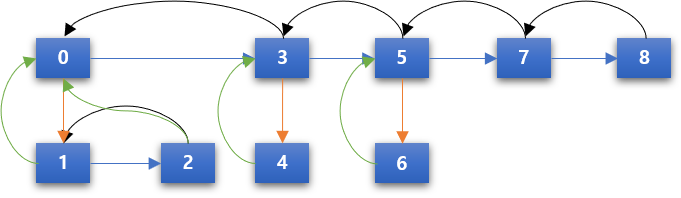
총 9개의 등치선이 추출되었으므로 위와 같이 총 9개의 계층 정보가 반환되는데 위의 각 9개 요소의 순서는 앞선 그림에서 표시된 등치선의 인덱스 순서와 동일합니다. 0부터 시작하고요. 그리고 각 요소는 다시 4개로 구성되는데.. [Next, Previous, First_Child, Parent]와 같습니다. 즉, [다음 등치선의 인덱스, 이전 등치선의 인덱스, 첫번째 자식 등치선의 인덱스, 부모 등치선의 인덱스] 입니다. 위의 계층 정보에 대한 내용은 다음 그림으로 표시될 수 있습니다.
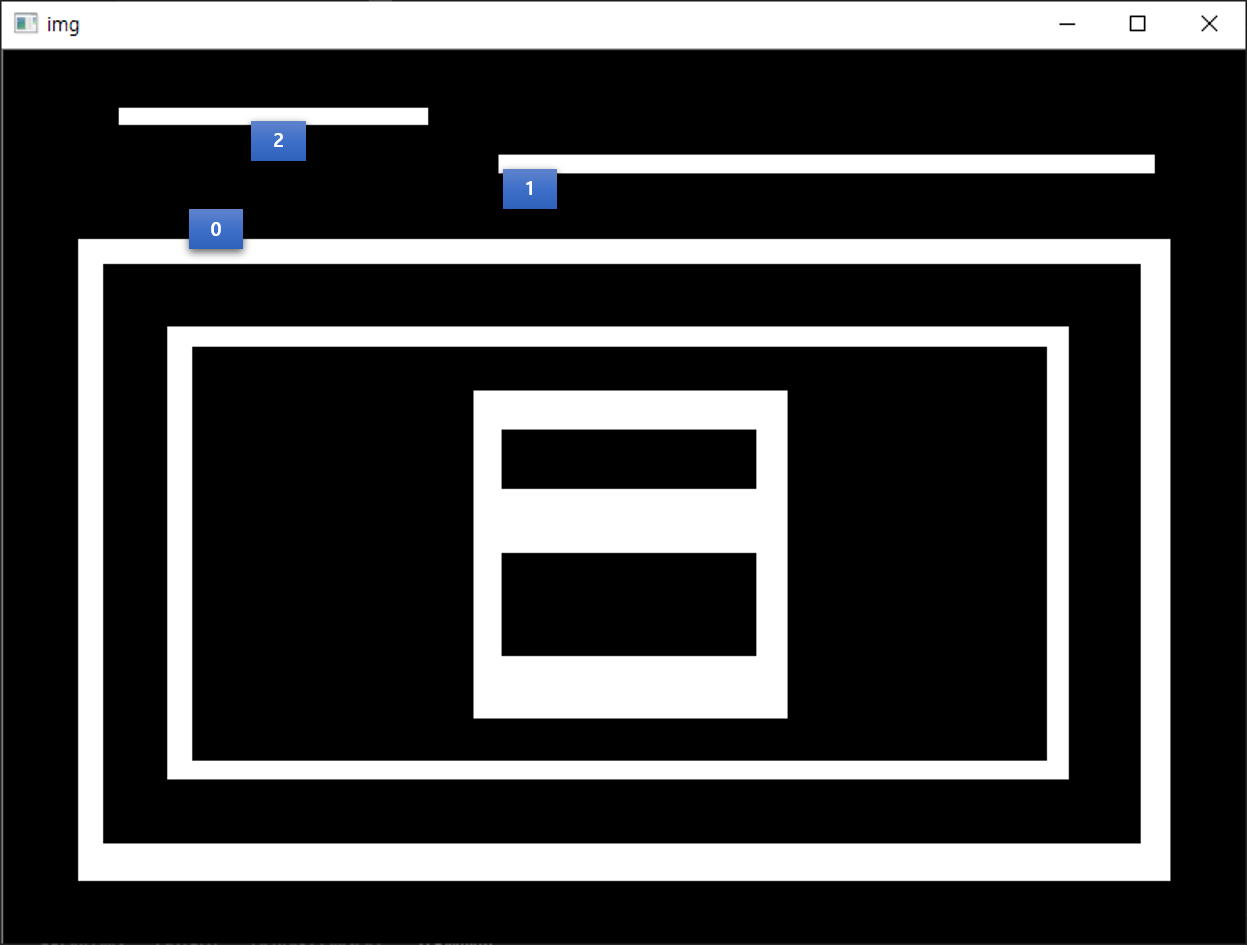
다음은 cv2.RETR_EXTERNAL 인자에 대한 등치선의 인덱스 번호에 대한 그림입니다.
계층 정보는 다음과 같습니다.
[[[ 1 -1 -1 -1]
  [ 2  0 -1 -1]
  [-1  1 -1 -1]]]
위 계층정보의 의미는 다음과 같습니다.

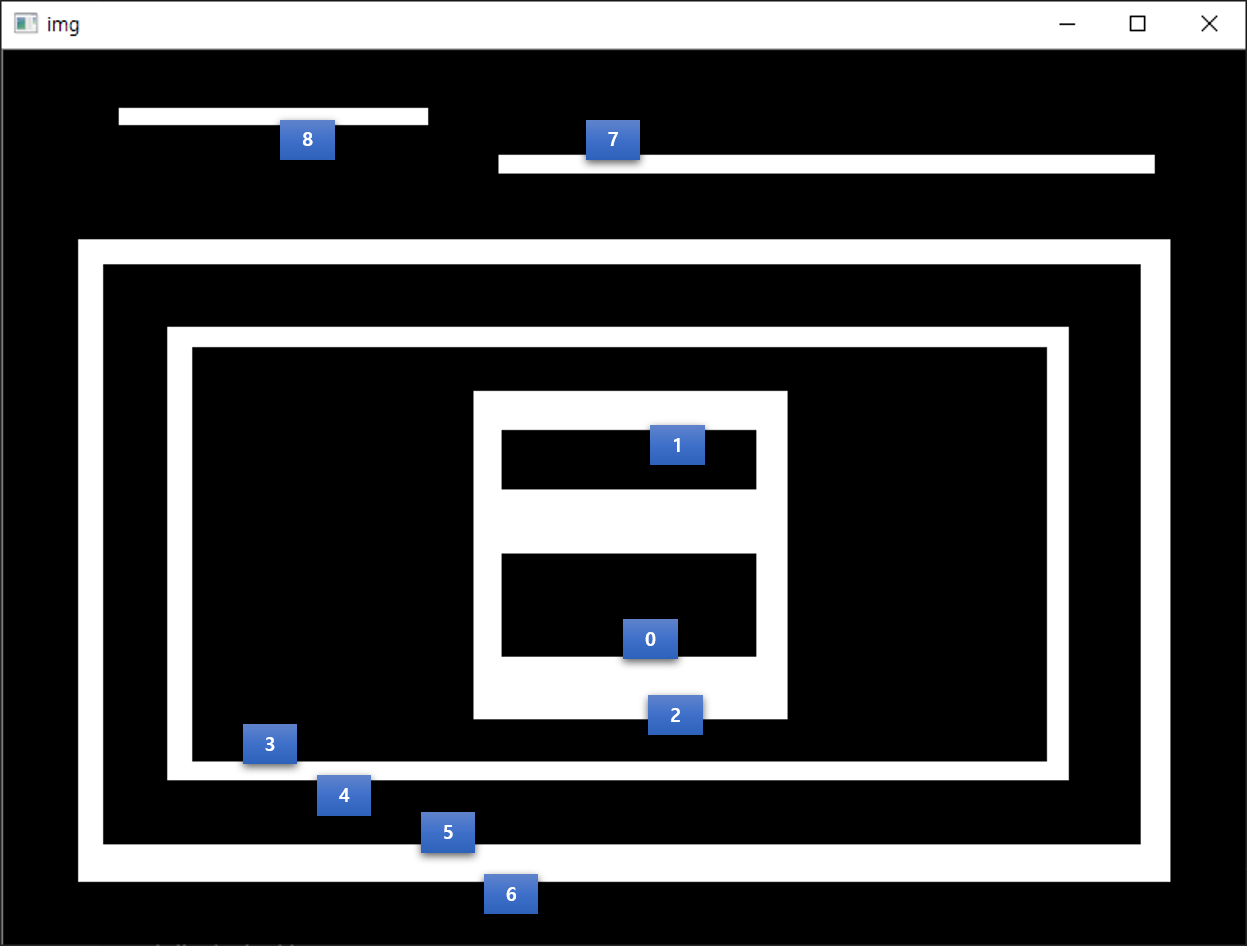
다음은 cv2.RETR_CCOMP 인자에 대한 등치선의 인덱스 번호에 대한 그림입니다.
계층 정보는 다음과 같습니다.
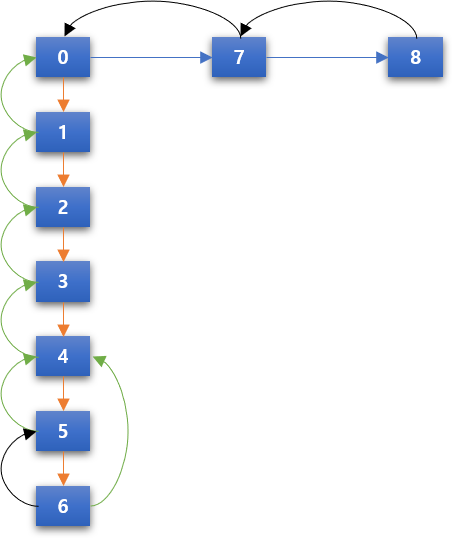
[[[ 3 -1  1 -1]
  [ 2 -1 -1  0]
  [-1  1 -1  0]
  [ 5  0  4 -1]
  [-1 -1 -1  3]
  [ 7  3  6 -1]
  [-1 -1 -1  5]
  [ 8  5 -1 -1]
  [-1  7 -1 -1]]]
위 계층정보의 의미는 다음과 같고요.
마지막으로 cv2.RETR_TREE 인자에 대한 등치선의 인덱스 번호에 대한 그림입니다.
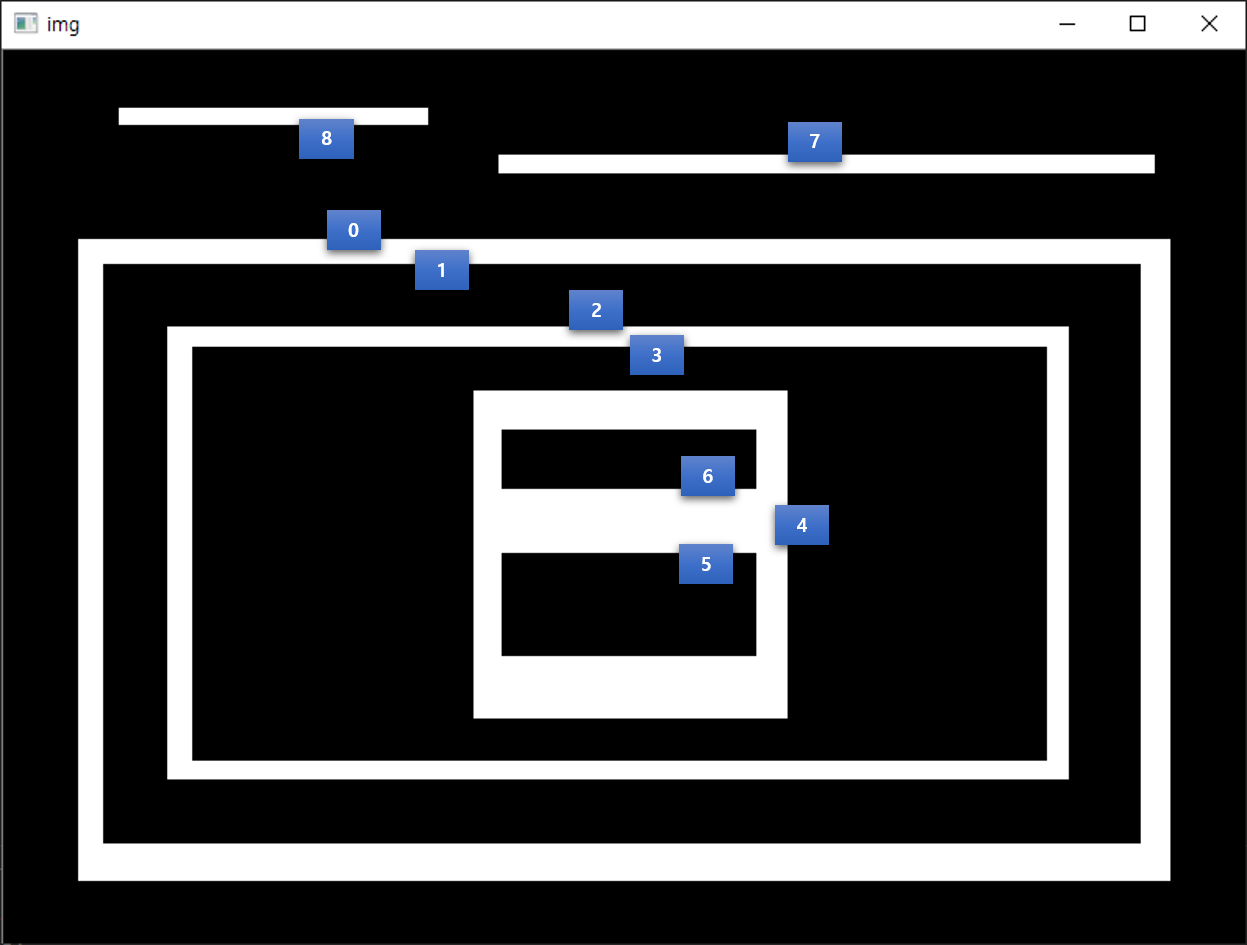
계층 정보는 다음과 같습니다.
[[[ 7 -1  1 -1]
  [-1 -1  2  0]
  [-1 -1  3  1]
  [-1 -1  4  2]
  [-1 -1  5  3]
  [ 6 -1 -1  4]
  [-1  5 -1  4]
  [ 8  0 -1 -1]
  [-1  7 -1 -1]]]
위의 계층정보의 의미를 도식화하면 다음과 같습니다.